
MaskSDM
with Shapley values to improve flexibility, robustness and explainability in species distribution modelling


Overview
As biodiversity declines, deep learning can help us understand where species occur and why.
In this work, we introduce MaskSDM, a new multimodal
masked-modeling approach that allows us to model the distributions of
12,738 plant species worldwide 🌱
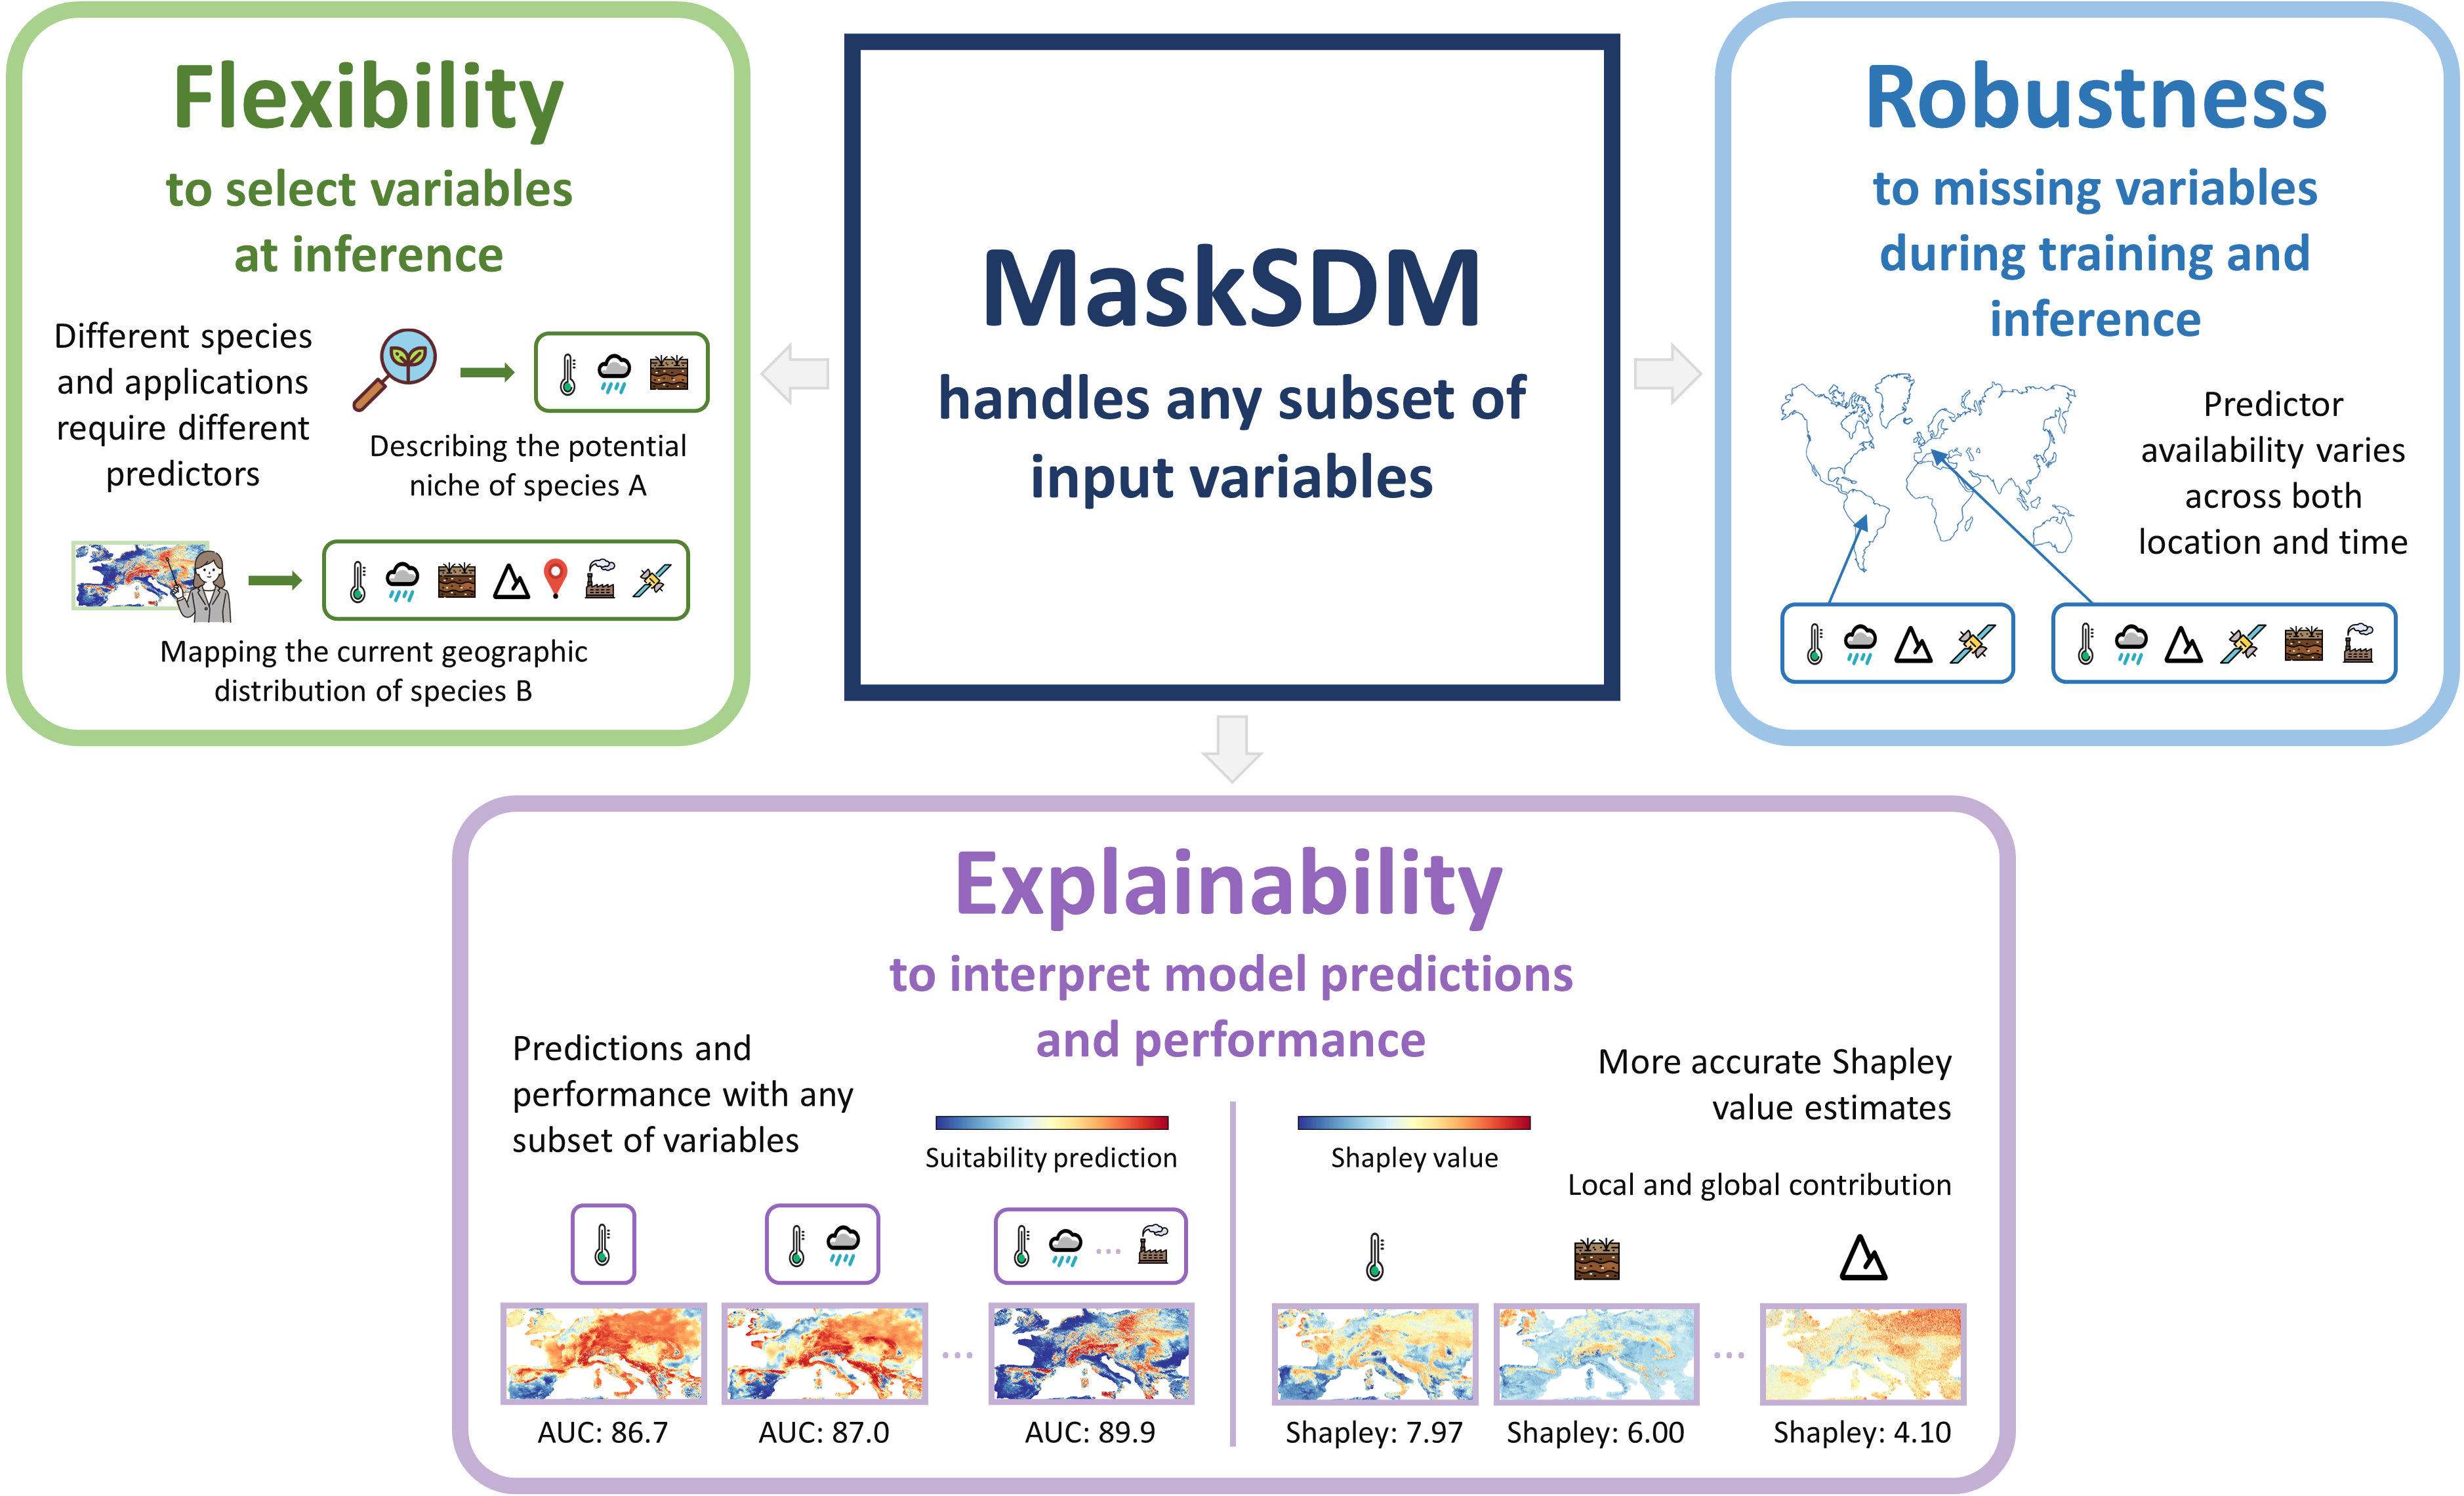
MaskSDM brings three key advantages for species distribution modeling (SDM) by enabling predictions to be generated using any subset of variables or modalities:
- 🧩 Flexibility — users can choose which environmental variables to include when making predictions
- ⚙️ Robustness — the model still works even when some environmental data are missing
- 🔍 Explainability — thanks to a novel way of computing Shapley values, we can identify which environmental factors matter most for each species
Using the transformer architecture, MaskSDM is designed as a general and scalable tool for ecologists and anyone working with biodiversity data, setting the stage for a foundation model in SDM 🗺️
Methodology
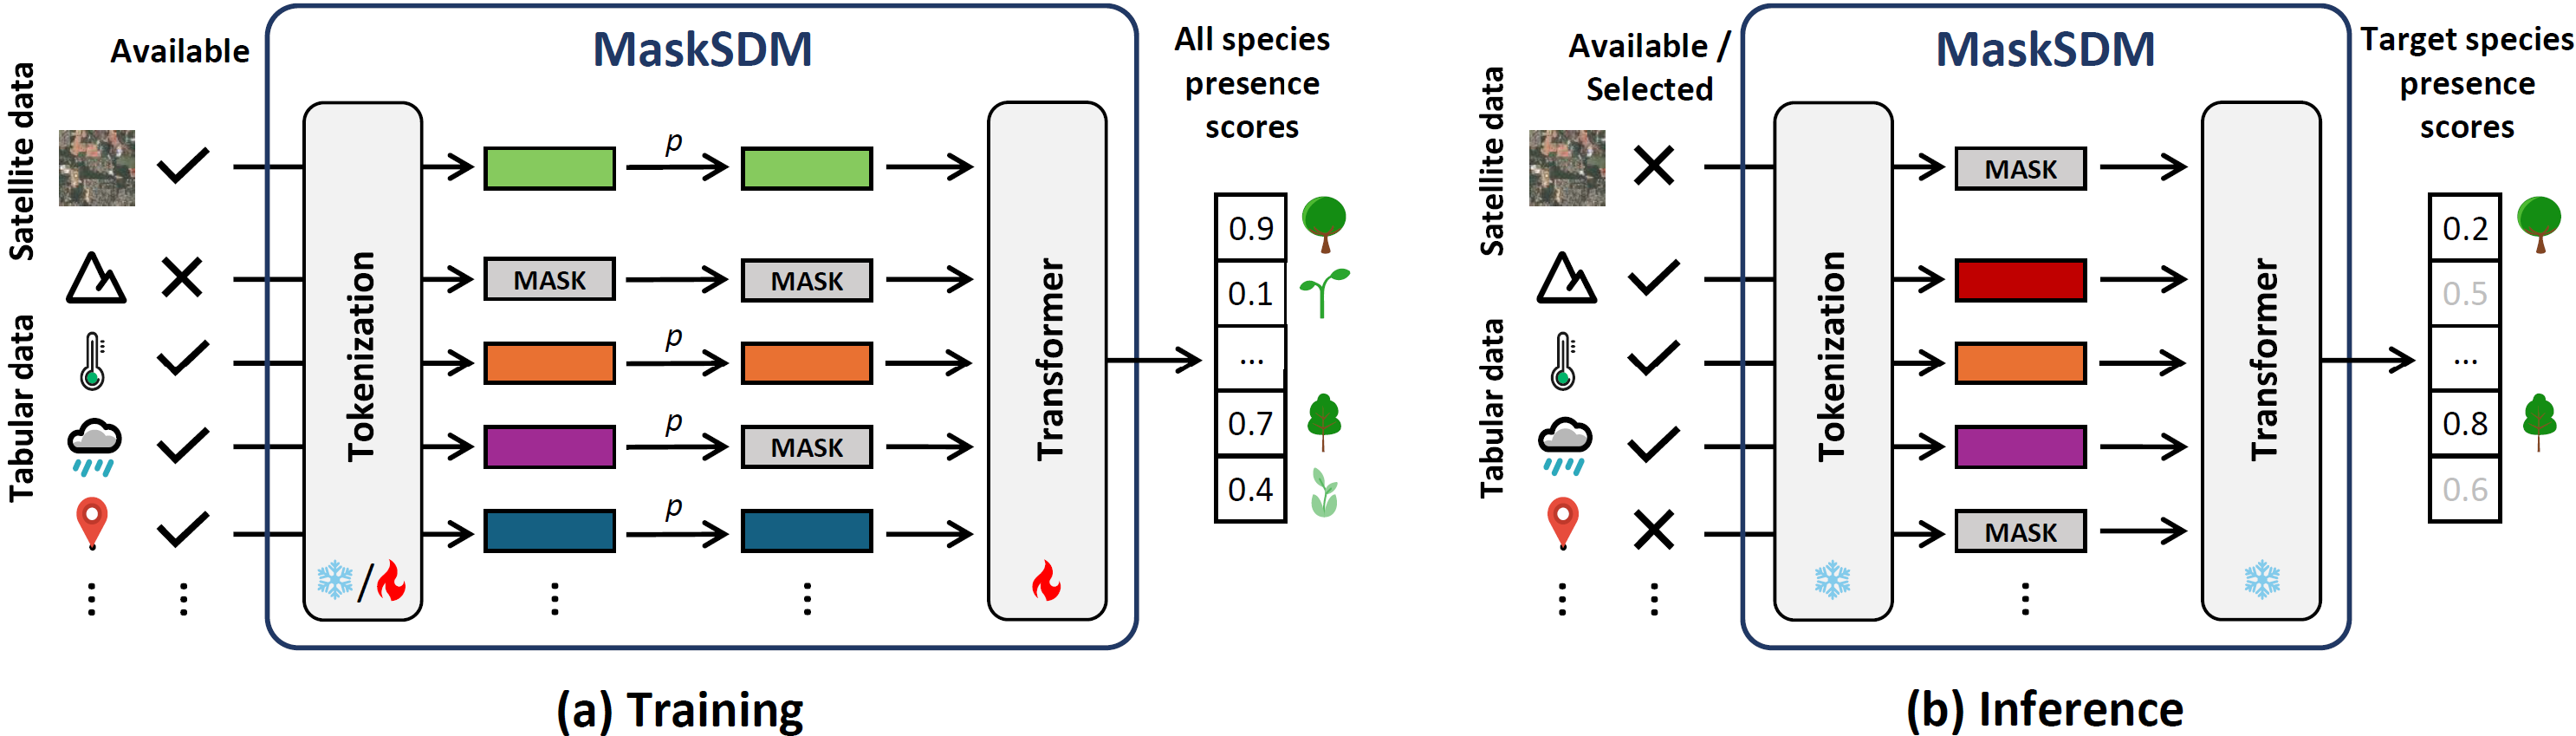
MaskSDM overcomes the limitations of traditional models that rely on a fixed set of environmental predictors. Instead, it is designed to work with any subset of available variables, making it adaptable to real-world situations where data availability varies across locations or species. Each input variable or modality is first converted into a shared high-dimensional representation through tokenization. These tokens are then processed by a transformer encoder, which captures complex, non-linear relationships between variables using self-attention. A key innovation is the use of masked data modelling (as in models such as BERT, MAE, 4M) during training. At each iteration, a random selection of variables is intentionally hidden and replaced with a learned mask token, forcing the model to correctly predict species presence even when information is missing. This strategy makes MaskSDM naturally robust to incomplete data and enables it to flexibly accept different combinations of predictors during inference.
MaskSDM is also used to improve the estimation of Shapley values for assessing predictor importance. Because MaskSDM can natively operate on arbitrary subsets of variables, it avoids the biased approximations that conventional approaches require like predictor independence. To efficiently handle the exponential number of possible predictor subsets, we apply a stratified Monte Carlo sampling strategy with Latin squares, which ensures a balanced coverage of subset sizes and leads to faster and more stable convergence when computing Shapley values.
Shapley values come from cooperative game theory and provide a fair way to distribute the total contribution of all predictors among them. For a predictor \(i\), the Shapley value \(\phi_i\) is defined as the average marginal contribution of \(i\) across all possible subsets \(S\) of the predictor set that do not include \(i\):
\[ \phi_i = \sum_{S \subseteq F \setminus \{x_i\}} \frac{|S|!\,(|F|-|S|-1)!}{|F|!} \Big( f(S \cup \{x_i\}) - f(S) \Big) \]
where \(N\) is the set of all predictors and \(f(\cdot)\) denotes the model prediction or performance computed using a given subset of predictors.
Dataset
We use the sPlotOpen global vegetation dataset, covering 12,738 plant species and containing 95,104 plots that are split using spatial block cross-validation. The long-tail distribution caused by class imbalance is addressed using the full weighted loss. Each plot is associated to 61 environmental predictors including climate (WorldClim), soil (SoilGrids), topography (SRTM), human footprint data, coordinates, and Sentinel-2 satellite features (SatCLIP), with MaskSDM handling missing variables.
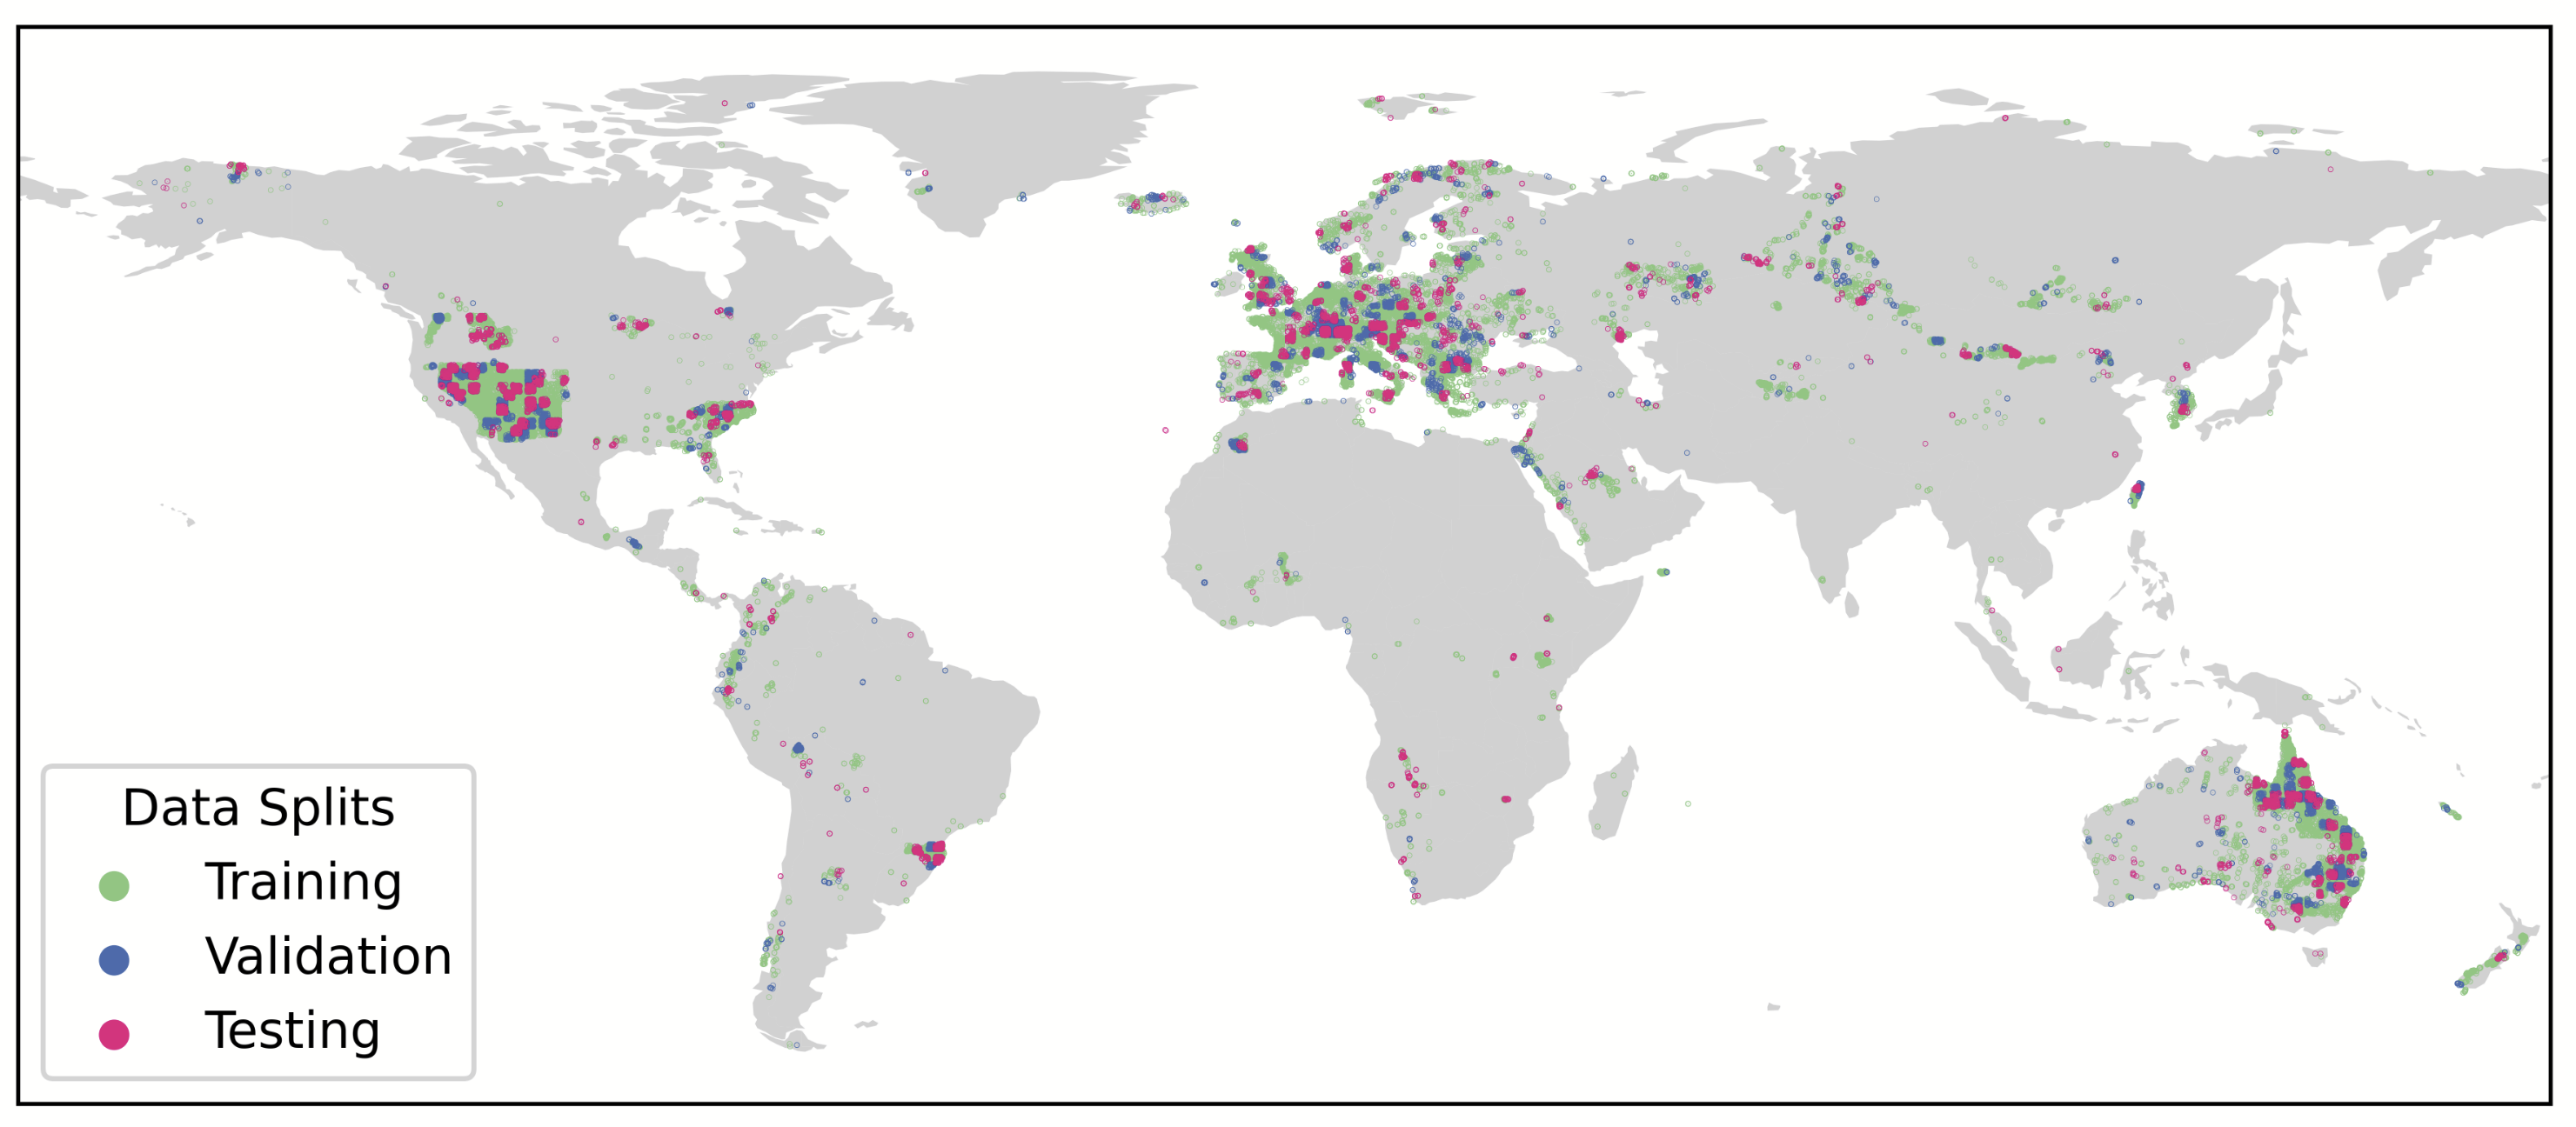
Geographic distribution of sPlotOpen plots across training, validation, and testing splits generated via spatial block cross-validation.
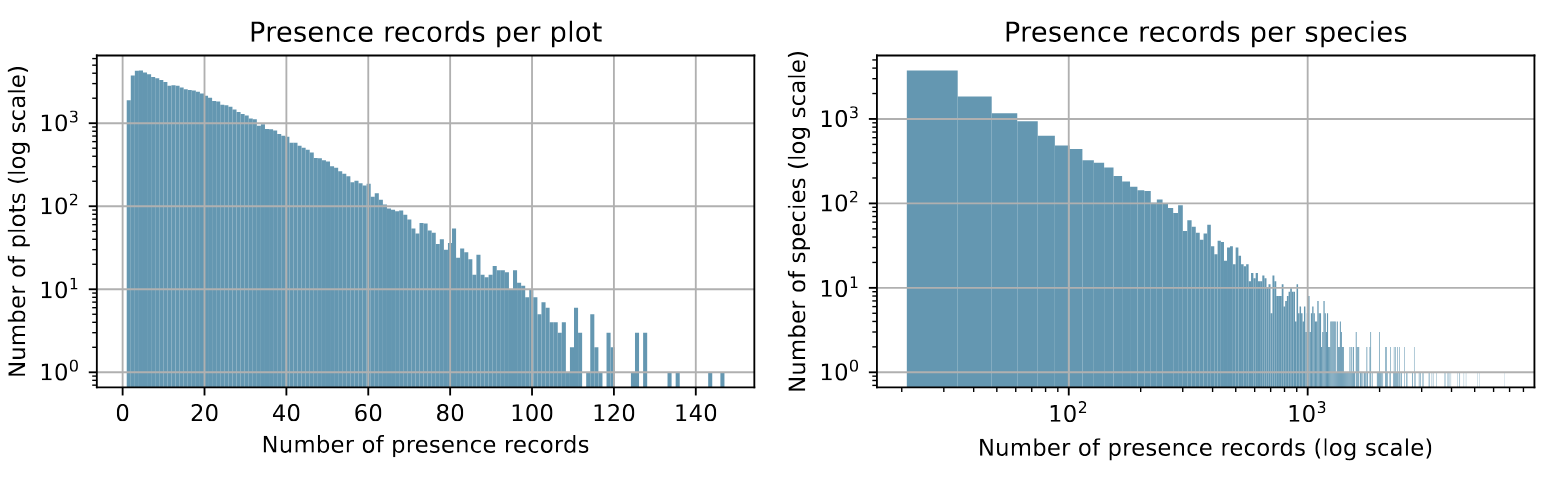
Distribution of presence records per plot and per species.
Results
A single MaskSDM model performs nearly as well on each tested input subset as an oracle model trained specifically for that subset, while outperforming imputation-based approaches. This enables predictions, performance metrics, and maps to be generated for any variable subset using only simple inference passes:
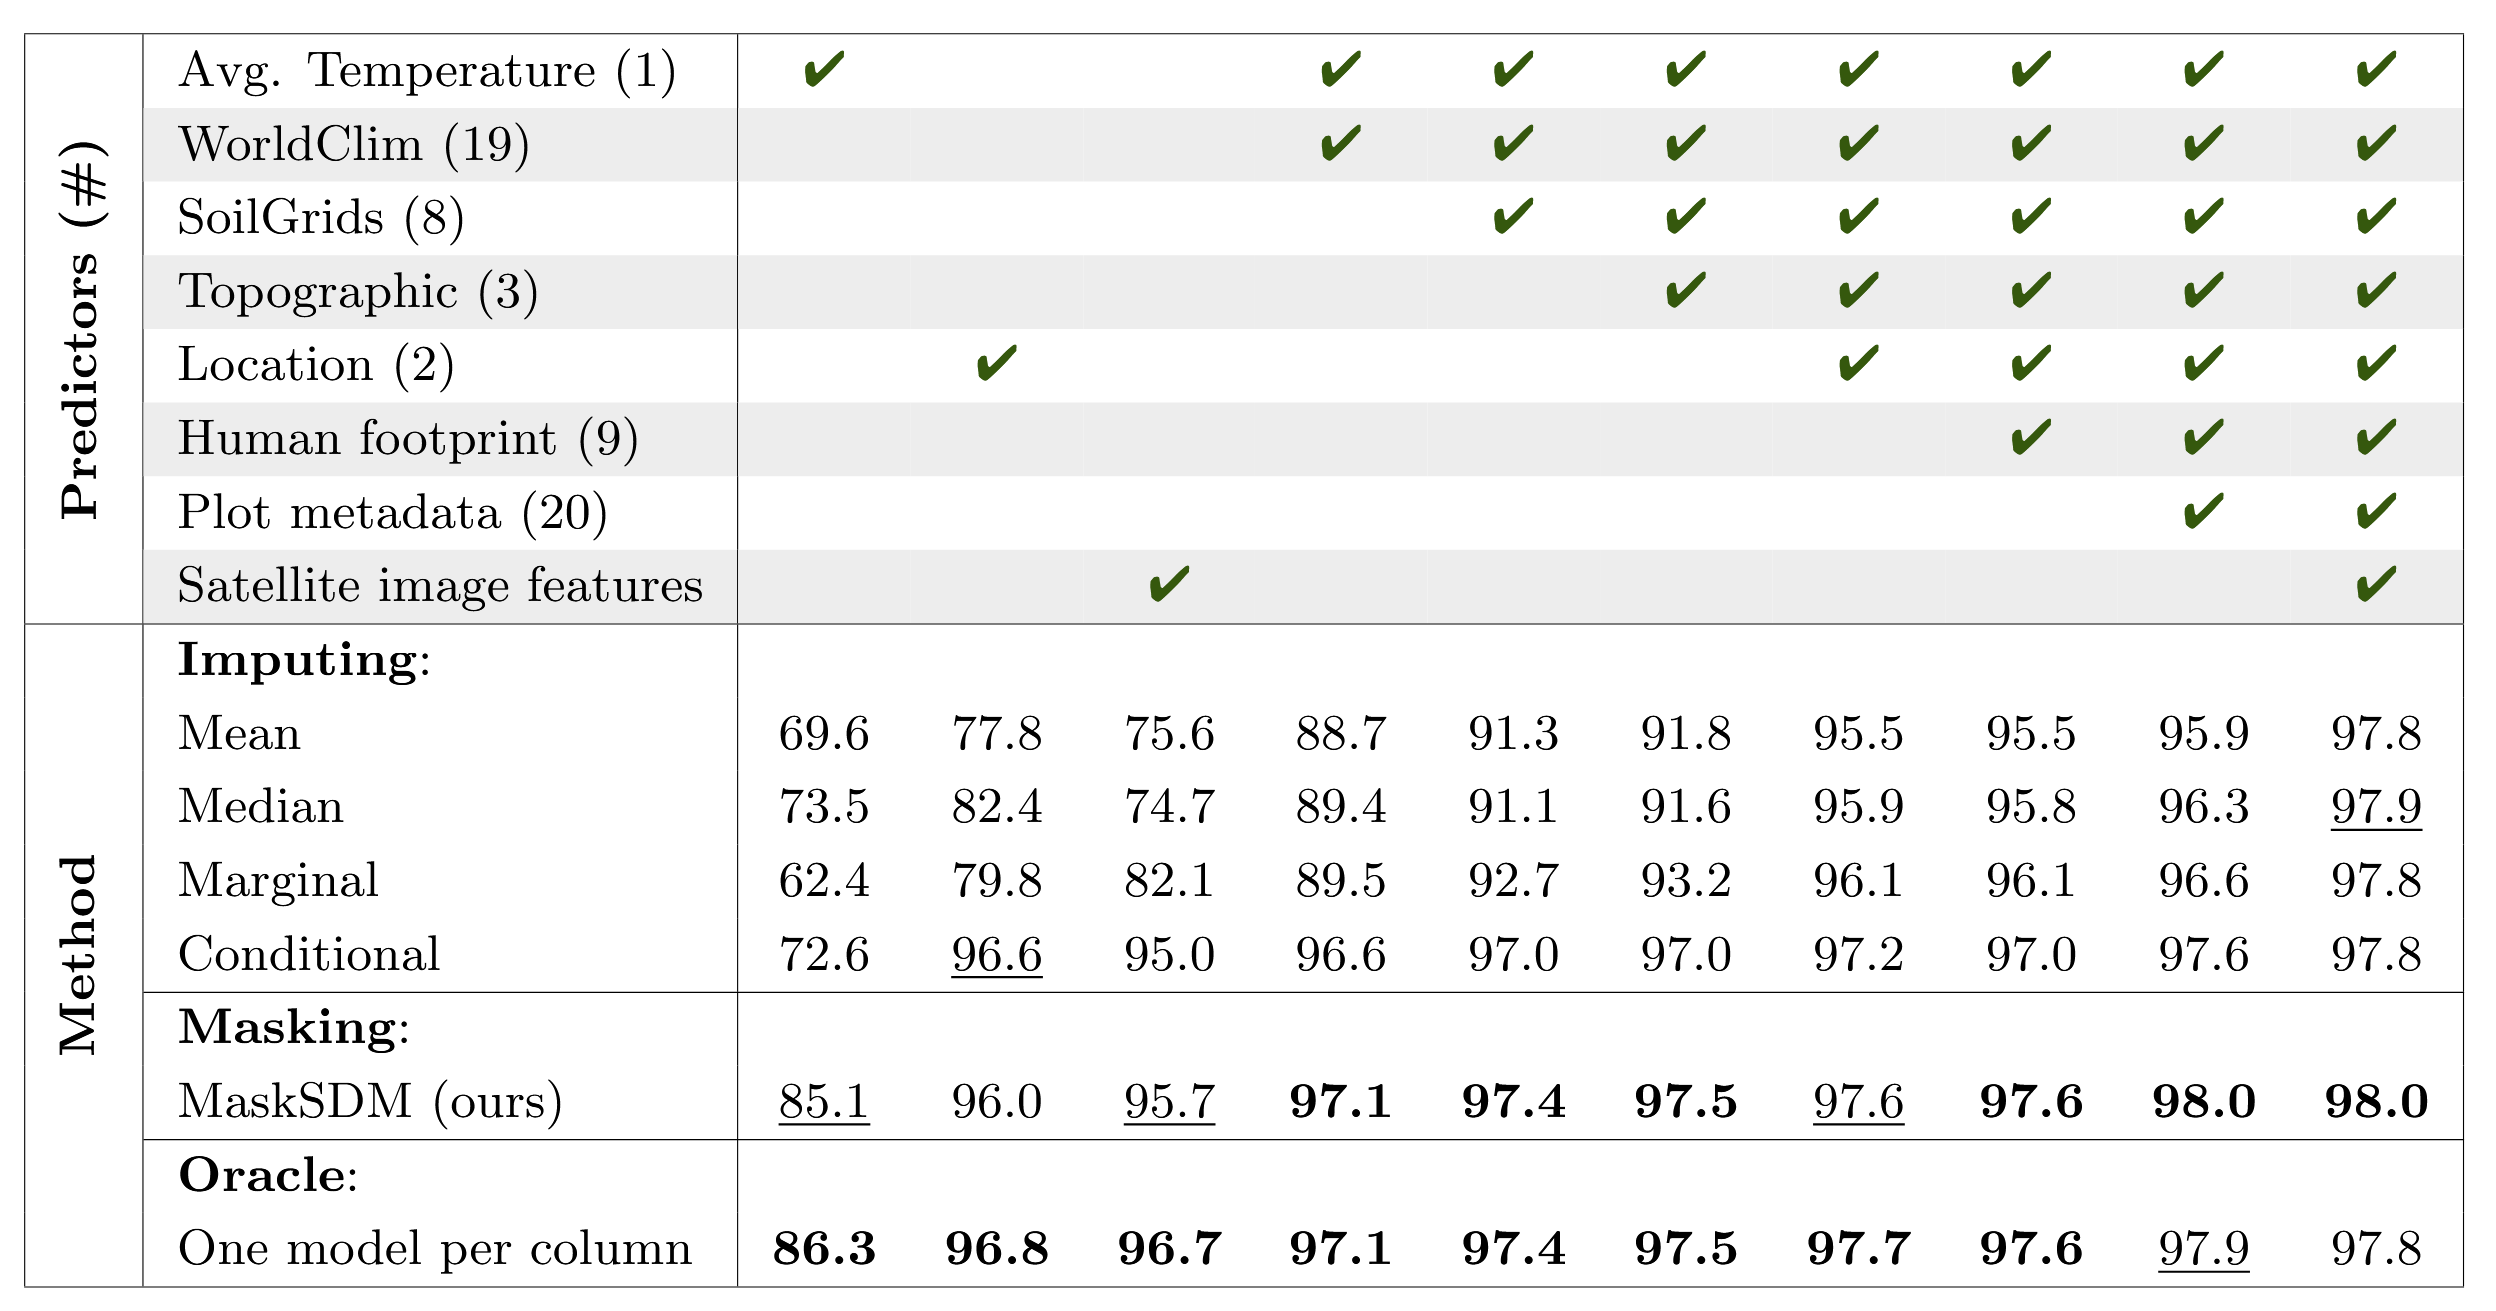
Mean test AUC performance of MaskSDM and baselines across subsets of input variables. Each row is produced by a single model for MaskSDM and imputing baselines, whereas the oracle trains one model per column.
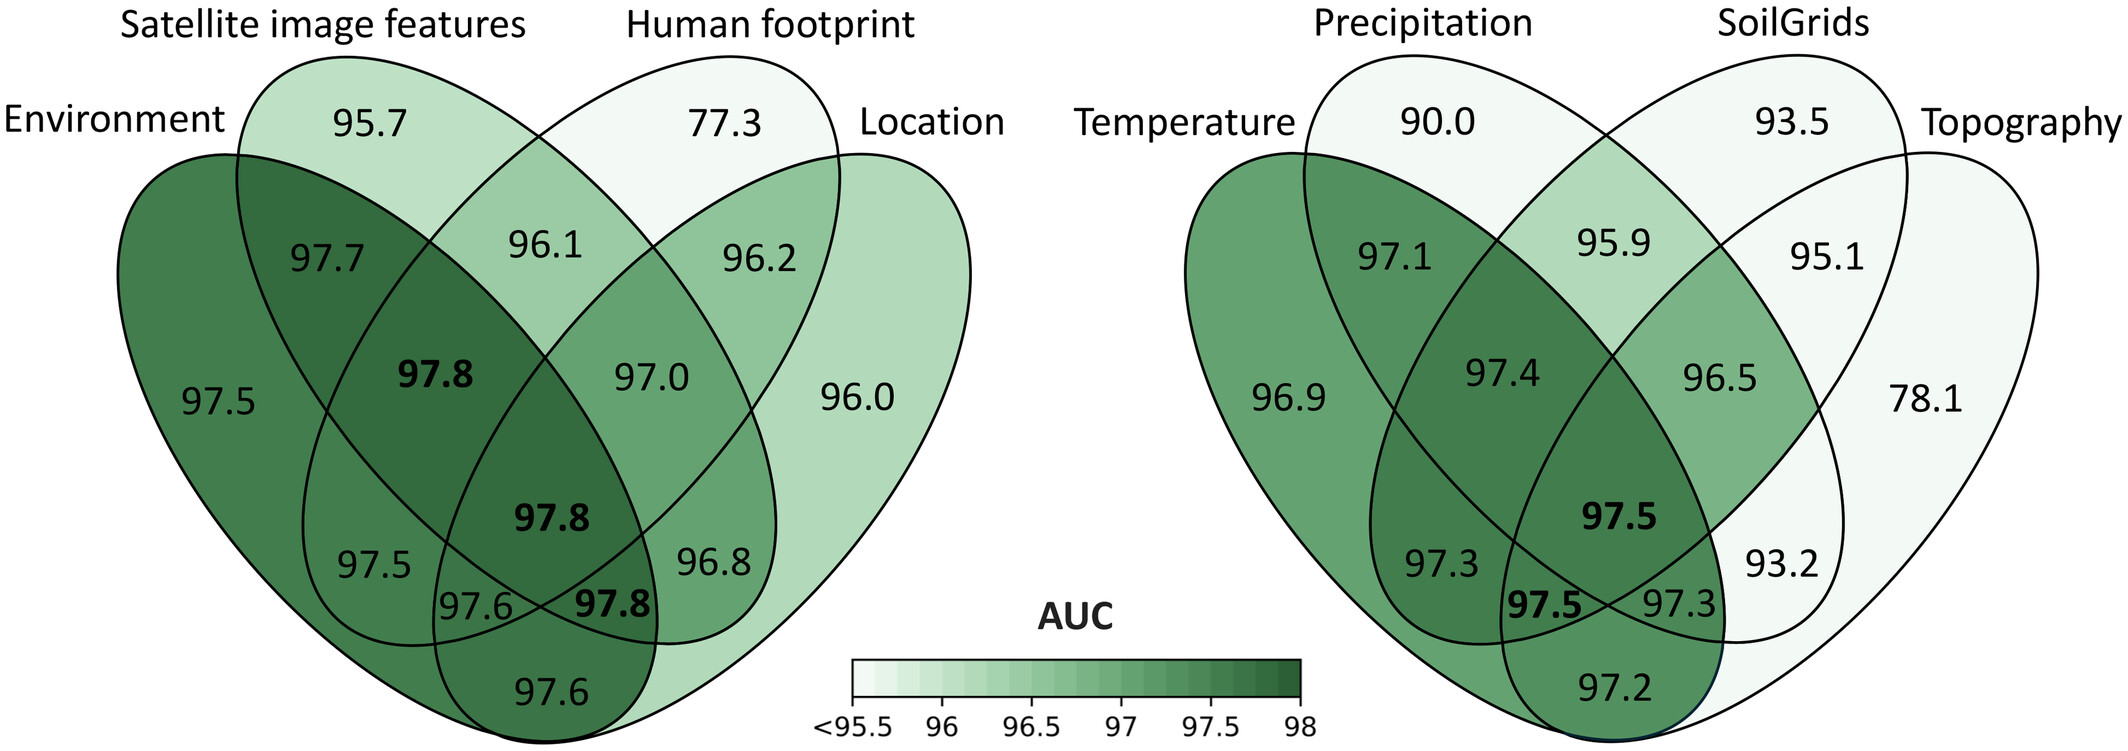
Mean test AUC performance on the test set for different subsets of predictors using MaskSDM.
Then, we can generate prediction maps for different input subsets to visualize how MaskSDM adapts to varying data availability:
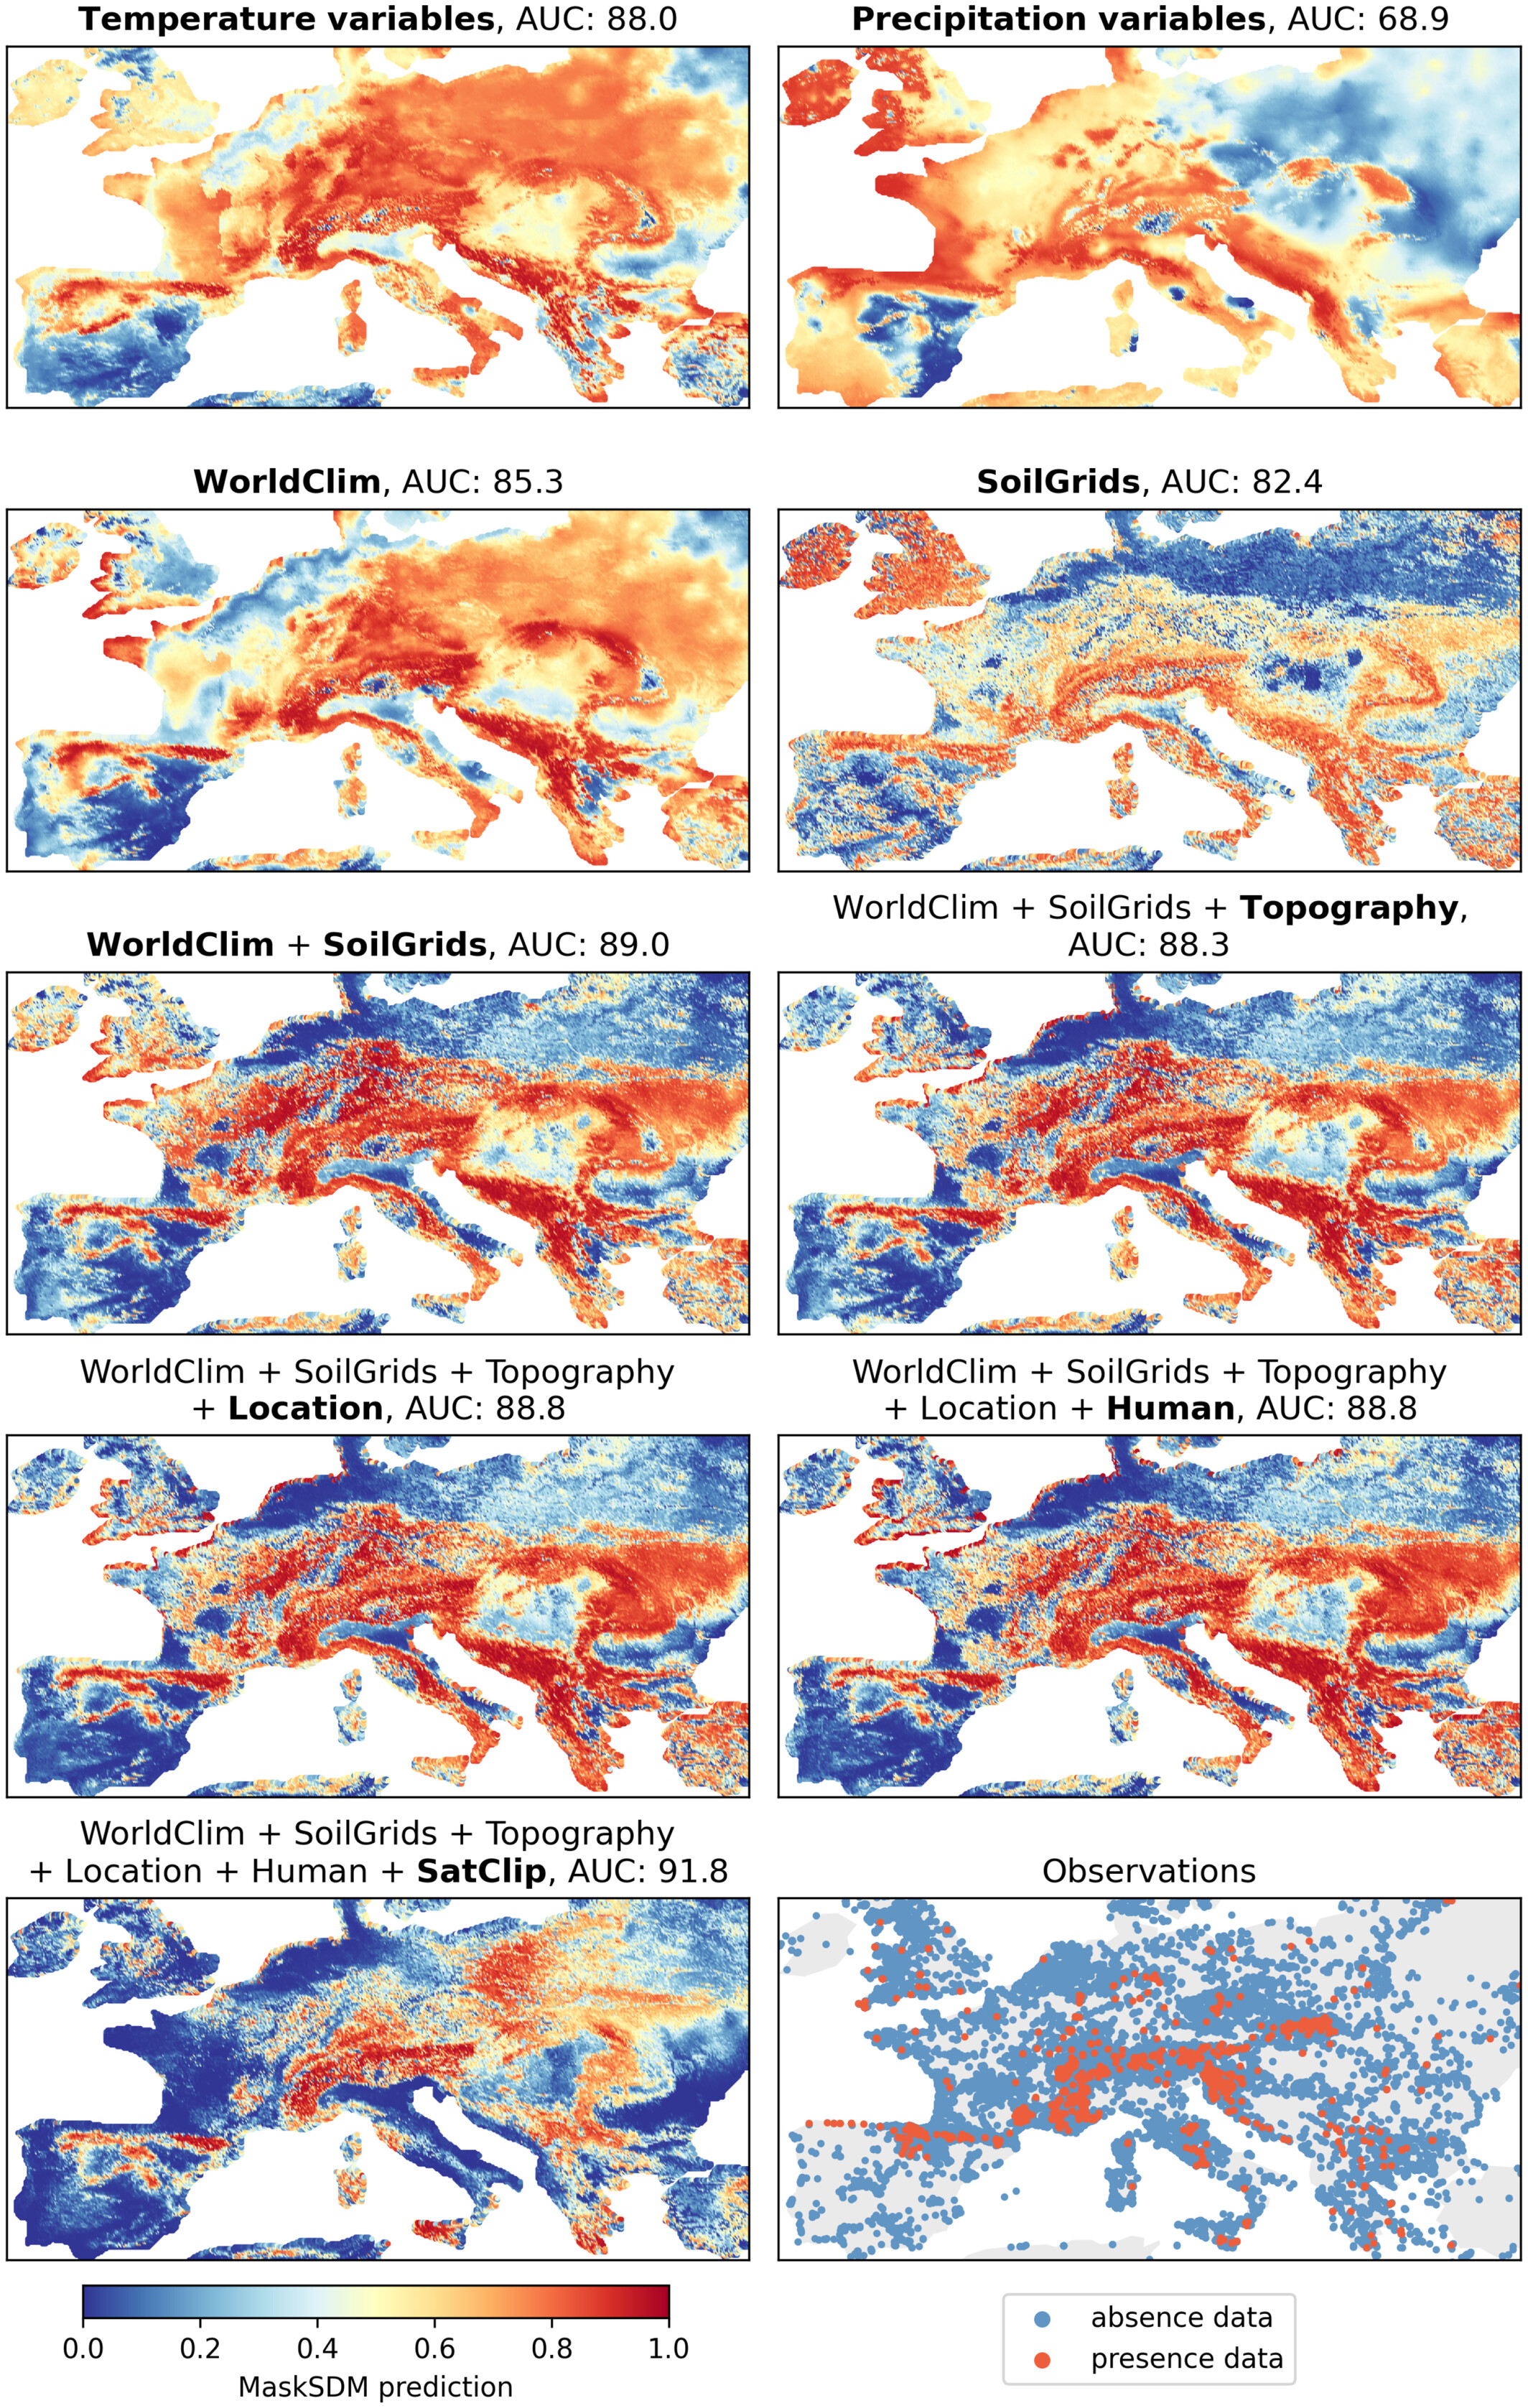
MaskSDM predicted suitability maps for kidney vetch (Anthyllis vulneraria) using different subsets of input variables.
A major contribution is our new Shapley value computation method, which avoids common assumptions like predictor independence by leveraging MaskSDM’s flexible-input design. This provides more precise insights into how climate, soil, topography, or human impact shape species distributions, both locally and globally:
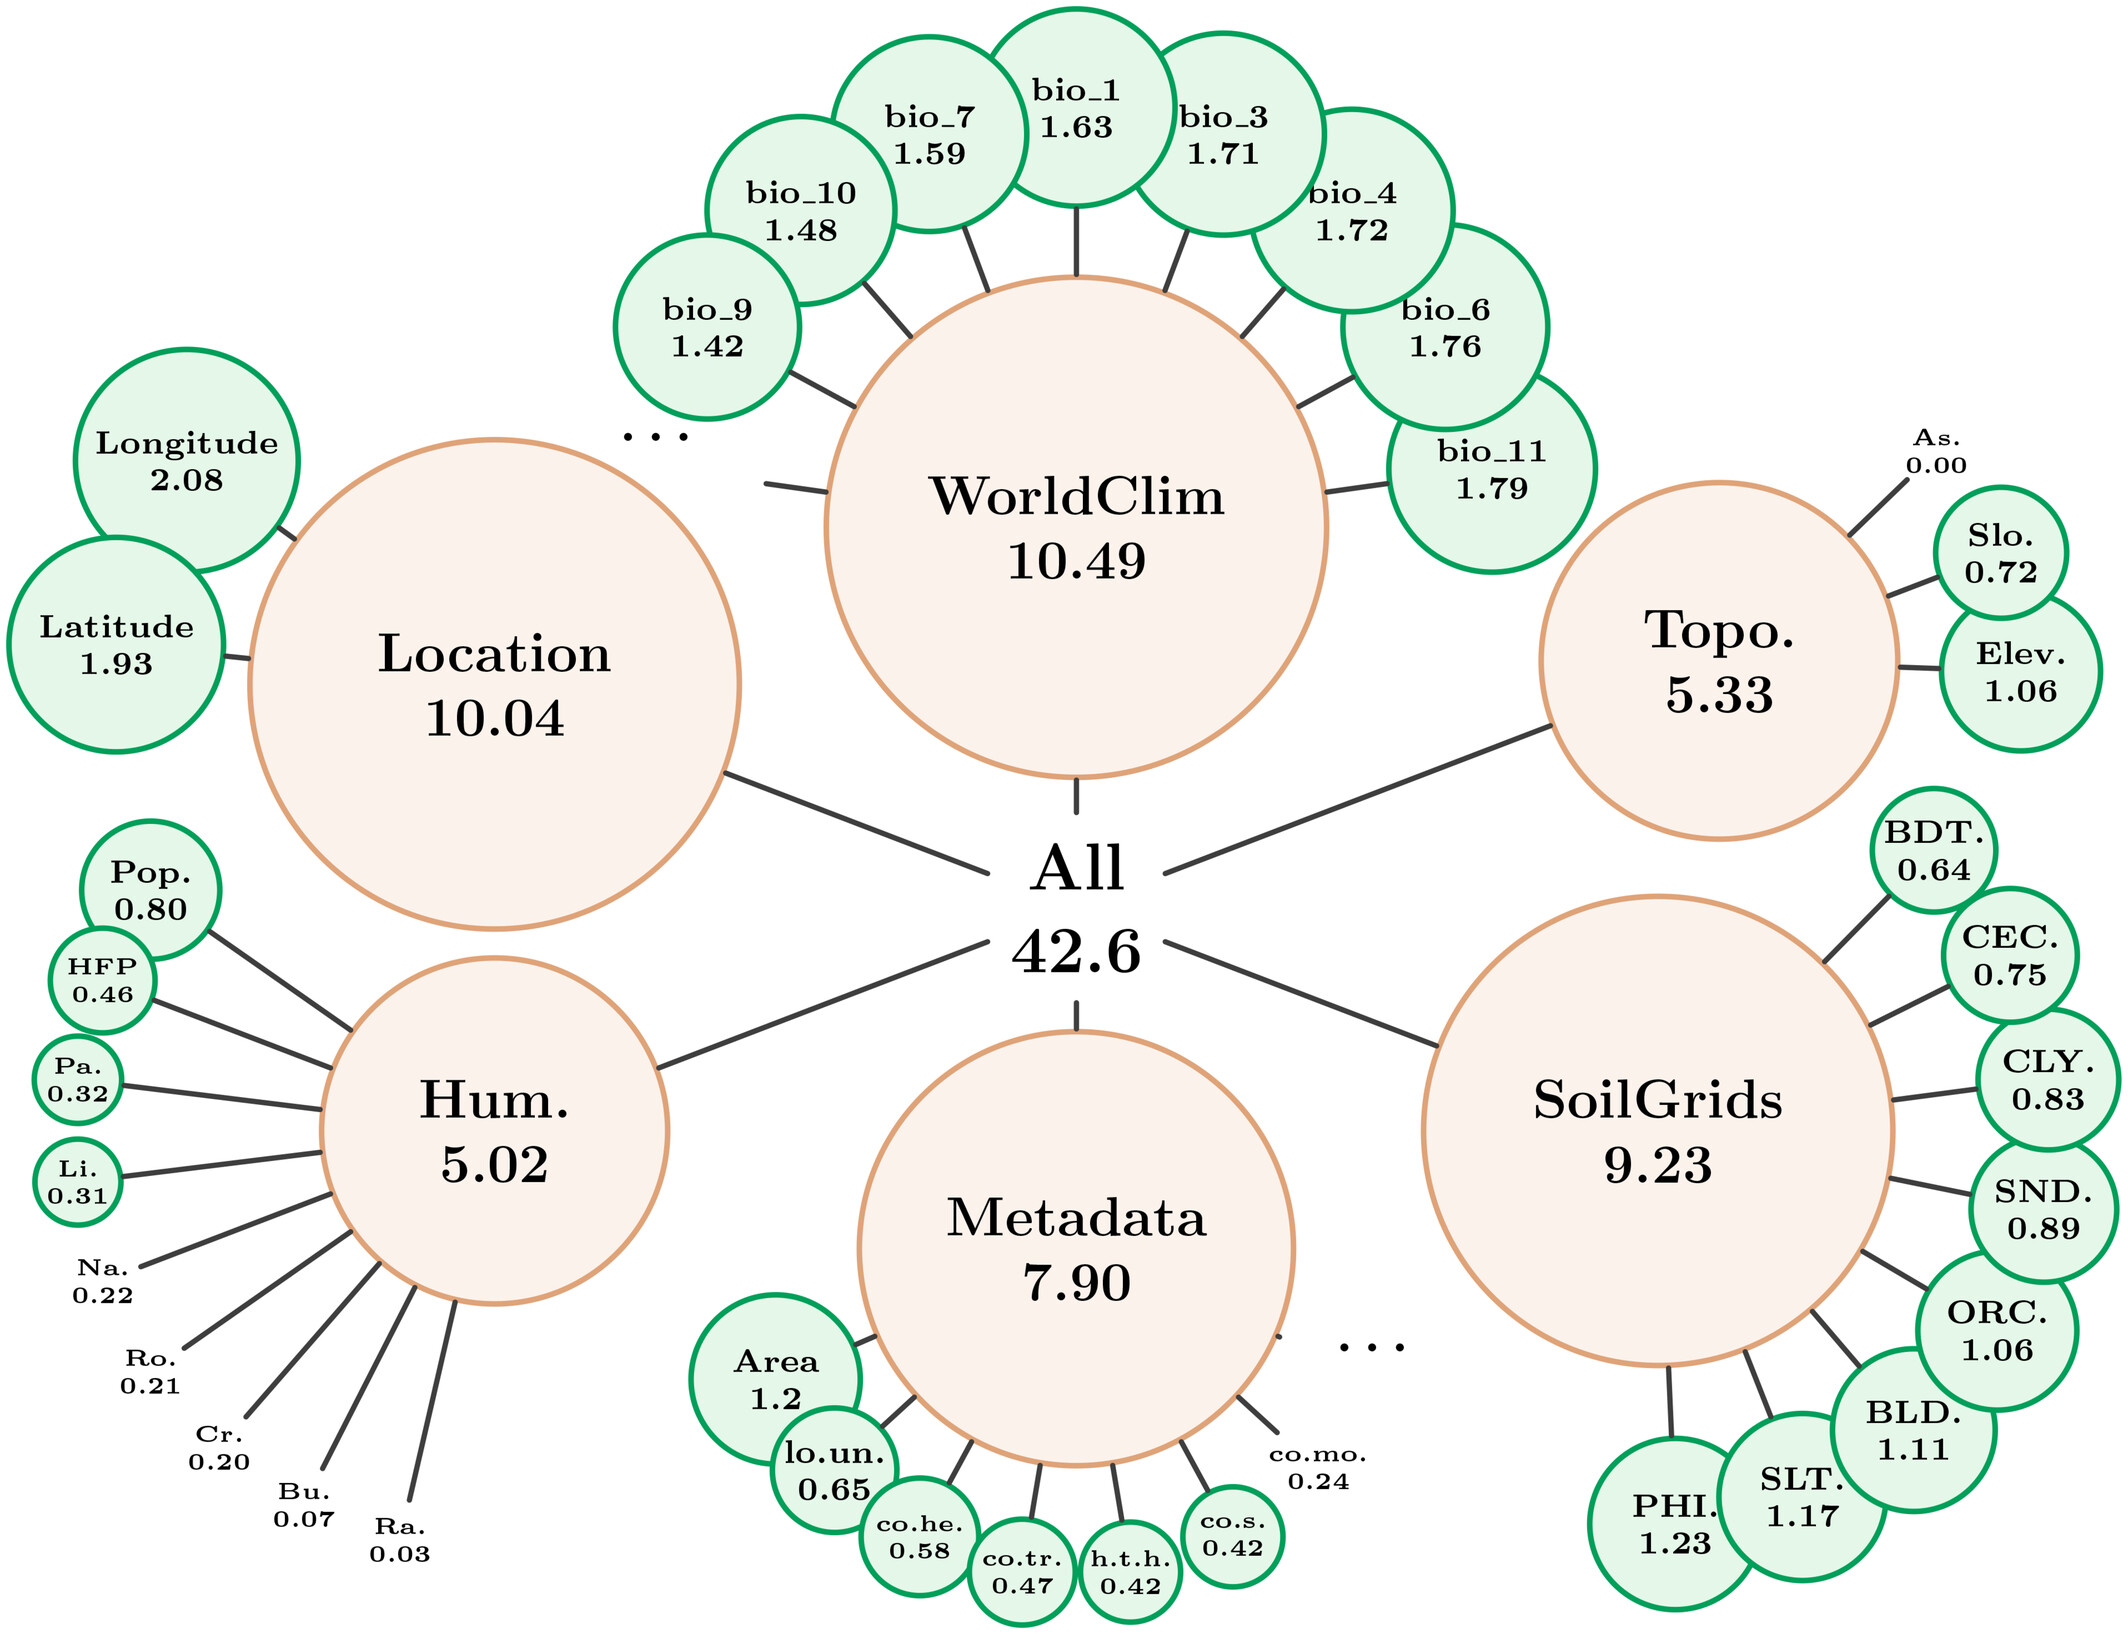
Shapley values explaining global AUC performance across all species on the test set, indicating the average contribution of individual predictors and predictor groups to the global performance
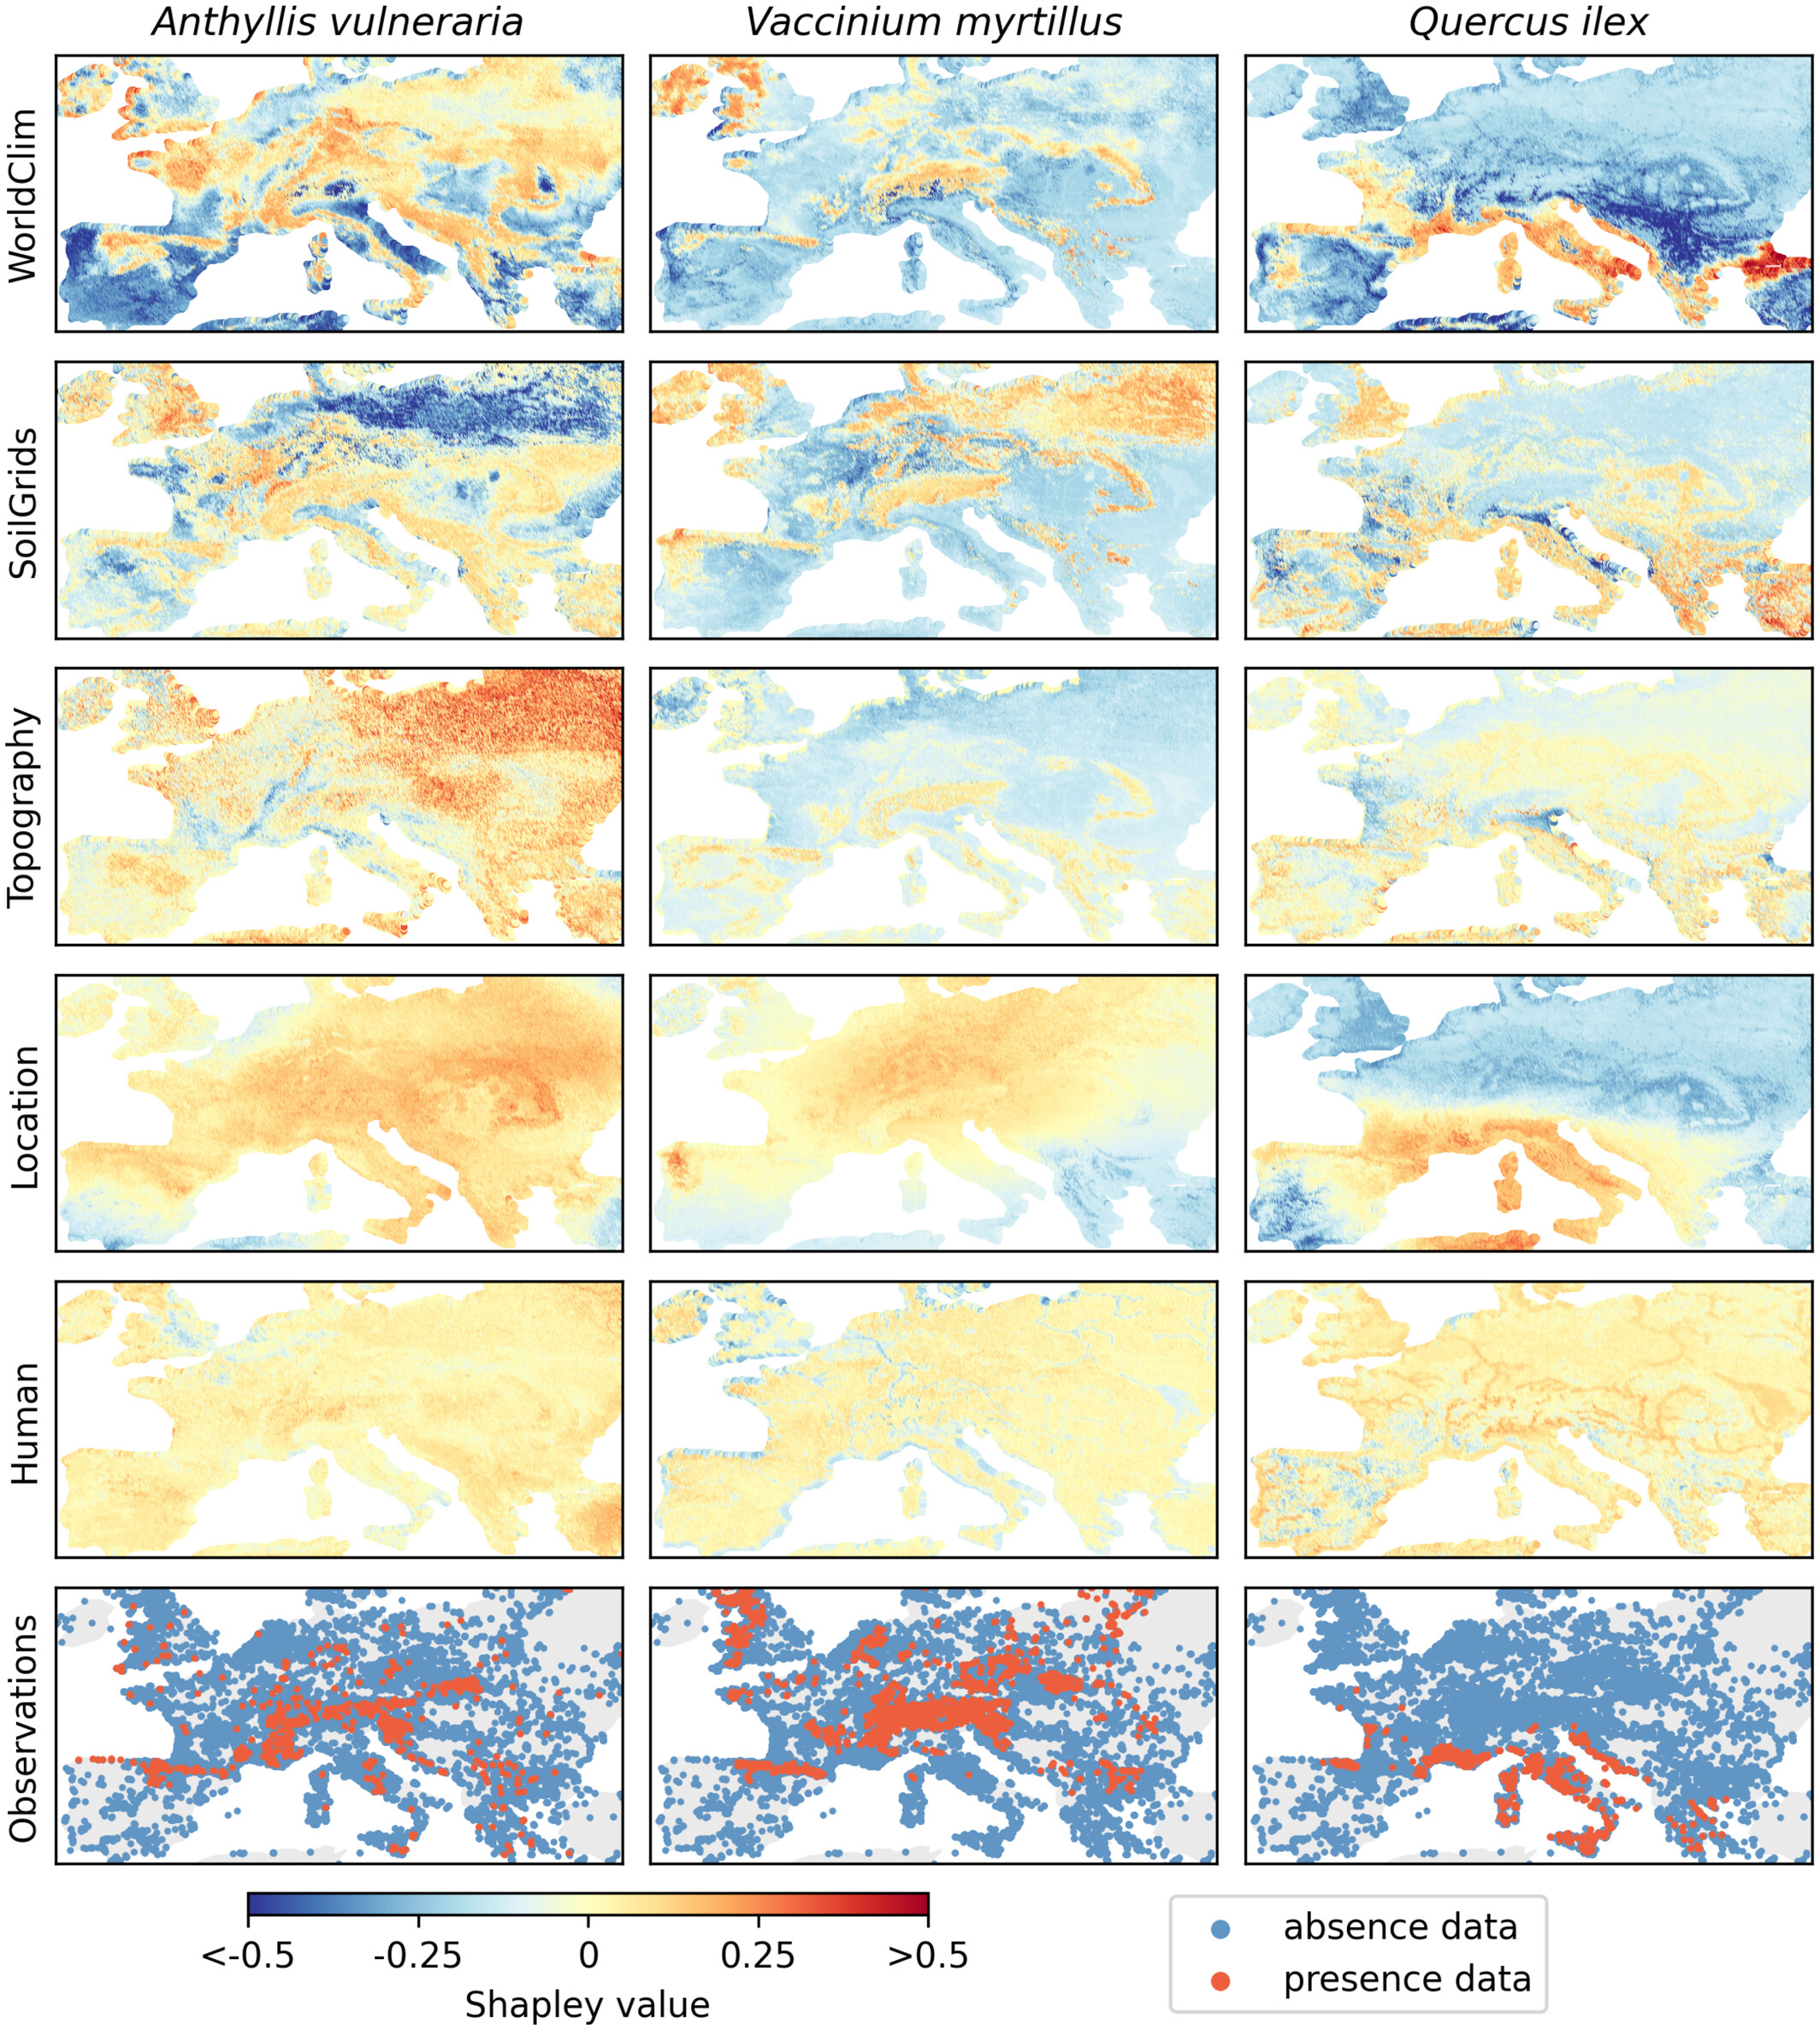
Shapley value maps representing the contribution of each predictor group to the MaskSDM predictions of kidney vetch (Anthyllis vulneraria), European blueberry (Vaccinium myrtillus), and holm oak (Quercus ilex).
Citation
@article{zbinden2025masksdm,
  title={MaskSDM with Shapley values to improve flexibility, robustness and explainability in species distribution modelling},
  author={Zbinden, Robin and Van Tiel, Nina and Sumbul, Gencer and Vanalli, Chiara and Kellenberger, Benjamin and Tuia, Devis},
  journal={Methods in Ecology and Evolution},
  year={2025},
  publisher={Wiley Online Library}
}
MaskSDM was first briefly presented at the Computer Vision for Ecology workshop at ECCV 2024:
@inproceedings{zbinden2024masksdm,
  title={MaskSDM: Adaptive Species Distribution Modeling Through Data Masking},
  author={Zbinden, Robin and Tiel, Nina van and Sumbul, Gencer and Kellenberger, Benjamin and Tuia, Devis},
  booktitle={European Conference on Computer Vision Workshops},
  pages={188--197},
  year={2024},
  organization={Springer}
}